With POSSE Ad-Hoc Reporting, building reports is intuitive and easy. Simple report customizations which used to take days to implement now take minutes from a web browser anywhere in the world, with no client-side software required.
"I would recommend the service (and product). [POSSE PLS] is much more user friendly than our previous system."
"The relationship that Computronix establishes with their customers is a true partnership. They want to see the project succeed and they go more than the extra mile to work with us to make sure success happens."
"I would like to add that the CX Project Team always delivers their product on time and meets project deadlines. They have also gone out of their way to listen and/or fix functionality that may not have met our original business needs."
POSSE Ad-Hoc Reporting
With our powerful POSSE Ad-Hoc reporting module, managers can see real-time graphic views into the performance of their department. POSSE Ad-Hoc uses an intuitive point-and-click interface for rapid report creation and display. Leverage the power of your POSSE database through this flexible reporting tool!
“Powered by POSSE” data in tandem with ThoughtSpot.™ AIexploration and insight discovery as easy as talking to a chatbot.
Run reports on desktops and mobile devices, and see your reports at any time, from anywhere.
Create clean, attractive 3D charts, flexible grids, and visual groupings to easily see your data.
Features
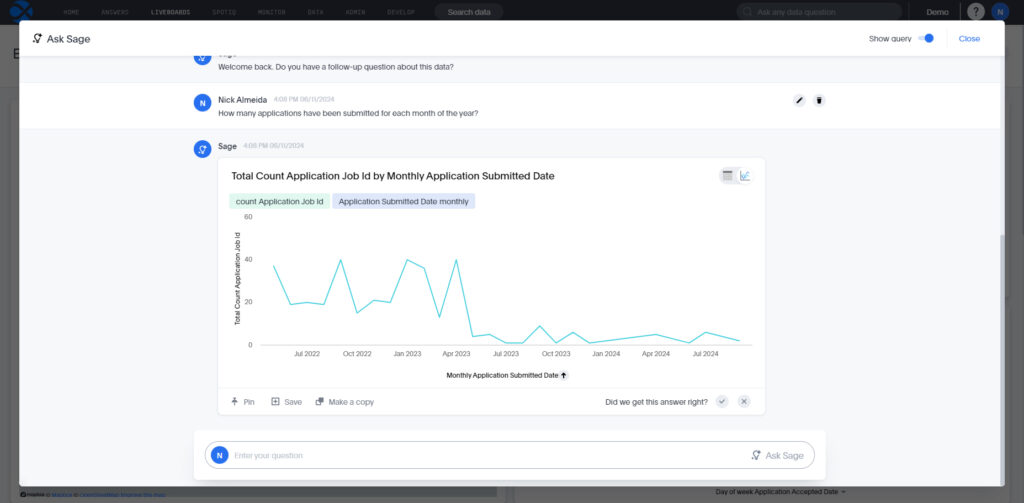
Ask
Instant Insights with Natural Language Search
Ask questions in plain English and get immediate, analyst-quality insights. No technical skills required—just ask and discover.
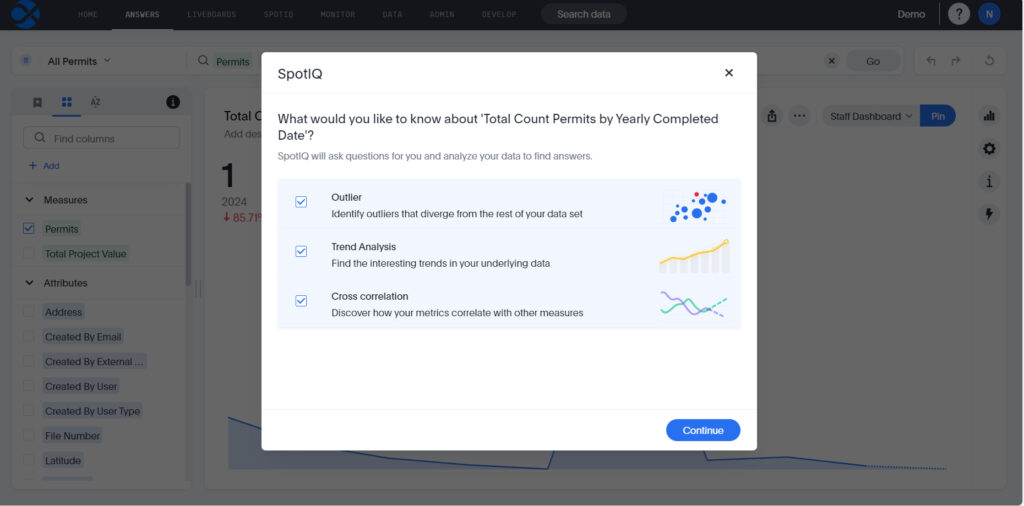
Diagnose
Discover the Why Behind Your Data
Uncover root causes, not just symptoms, with AI-driven insights. Spot anomalies and drill down to details effortlessly—no predefined paths needed.
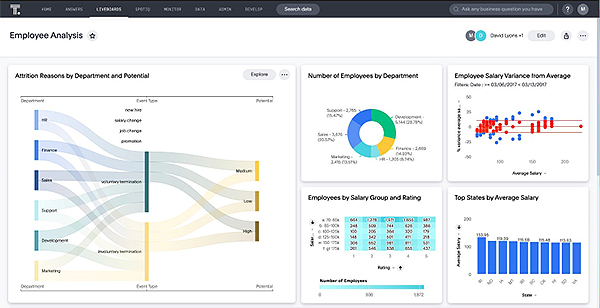
Visualize
Experience Real-Time Interactive Visualizations
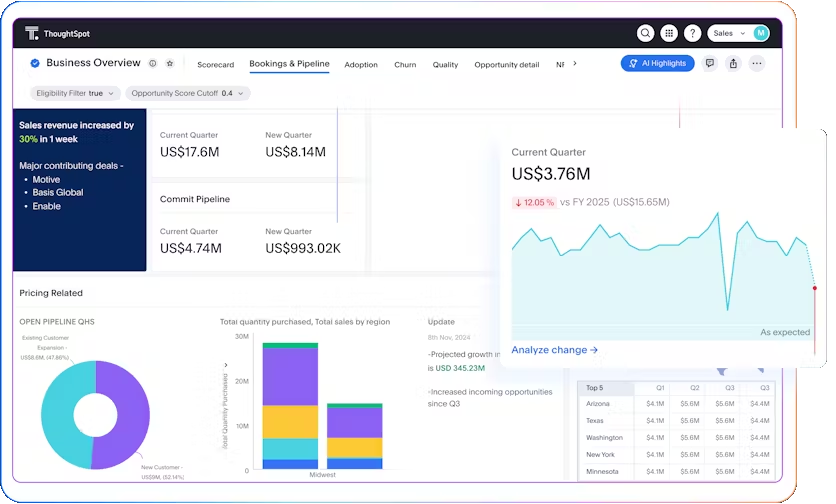
Move beyond static dashboards. Liveboards provide live, interactive data views, keeping you updated with personalized, actionable insights.
AI Analyst
No matter where your business data lives, the complexity of your dataset, or how specific your question, ThoughtSpot delivers reliable answers in an intuitive, conversational experience.
The breadth of questions it can support is unmatched – from comparisons and cohort analyses to time and location reasoning – and ThoughtSpot delivers the answers to these questions automatically.
Enterprise Business Intelligence
Unlike static dashboards, Liveboards provide a real-time, interactive view of your data, keeping you updated on business metrics as they evolve.
Easily drill down from high-level analytics to the most granular insights without the need for pre-defining drill paths. Or, let AI and Machine Learning do the work for you with automated, personalized and actionable insights serving up the most important information.
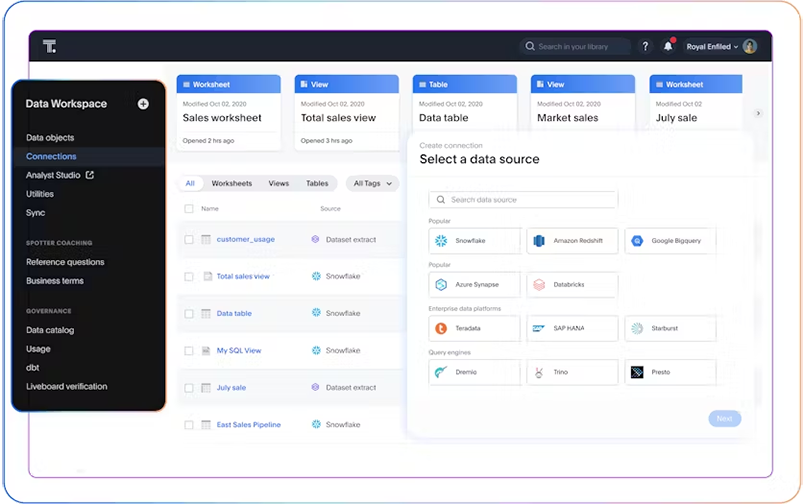
Any Data, Anywhere
Data is the foundation of every AI-driven insight. If any piece of the data puzzle is missing, AI solutions cannot deliver reliable insights across your business.
By connecting all your POSSE data in a single platform, no matter its format, size, or location in the ecosystem, your Ad-Hoc Reporting tool becomes a single source of truth that eliminates data silos, ensuring that every decision is based on the most complete and accurate picture of your business.
Empower Business Users
With POSSE Ad-Hoc Reporting, building reports is intuitive and easy. Simple report customizations which used to take days to implement now take minutes from a web browser anywhere in the world, with no client-side software required.
The POSSE Ad-Hoc point-and-click report design environment is intended for the standard business user, allowing IT staff to focus on more complex support issues.
Instantly See What You Need
POSSE Ad-Hoc Reporting gives you direct access to your database and lets you transform raw data into useful, readily understood information.
POSSE Ad-Hoc understands the ‘shape’ of your data and automatically guides the user as to what kinds of data can be linked together to produce the desired report. POSSE Ad-Hoc enables you to create summaries, subtotals, calculations, and formats, employing flexible and dynamic smart filters to get the information you really need to make informed decisions.
Customize Your Reports
The Report Viewer lets you easily modify a previously created report or save a variation of the report.
The WYSIWYG interface lets you make changes on the fly with ease. You can create great-looking 3D charts, flexible grids, and visual groupings, and format your data into tables, reports, charts, pivots, and gauges. You can also print and email reports, or export them to popular file formats such as Word, Excel, and PDF.
“We’ve had excellent feedback from internal and external users. We now have contractors using POSSE to monitor their jobs. Staff productivity gains based on new business processes using POSSE made us an award-winning organization.”